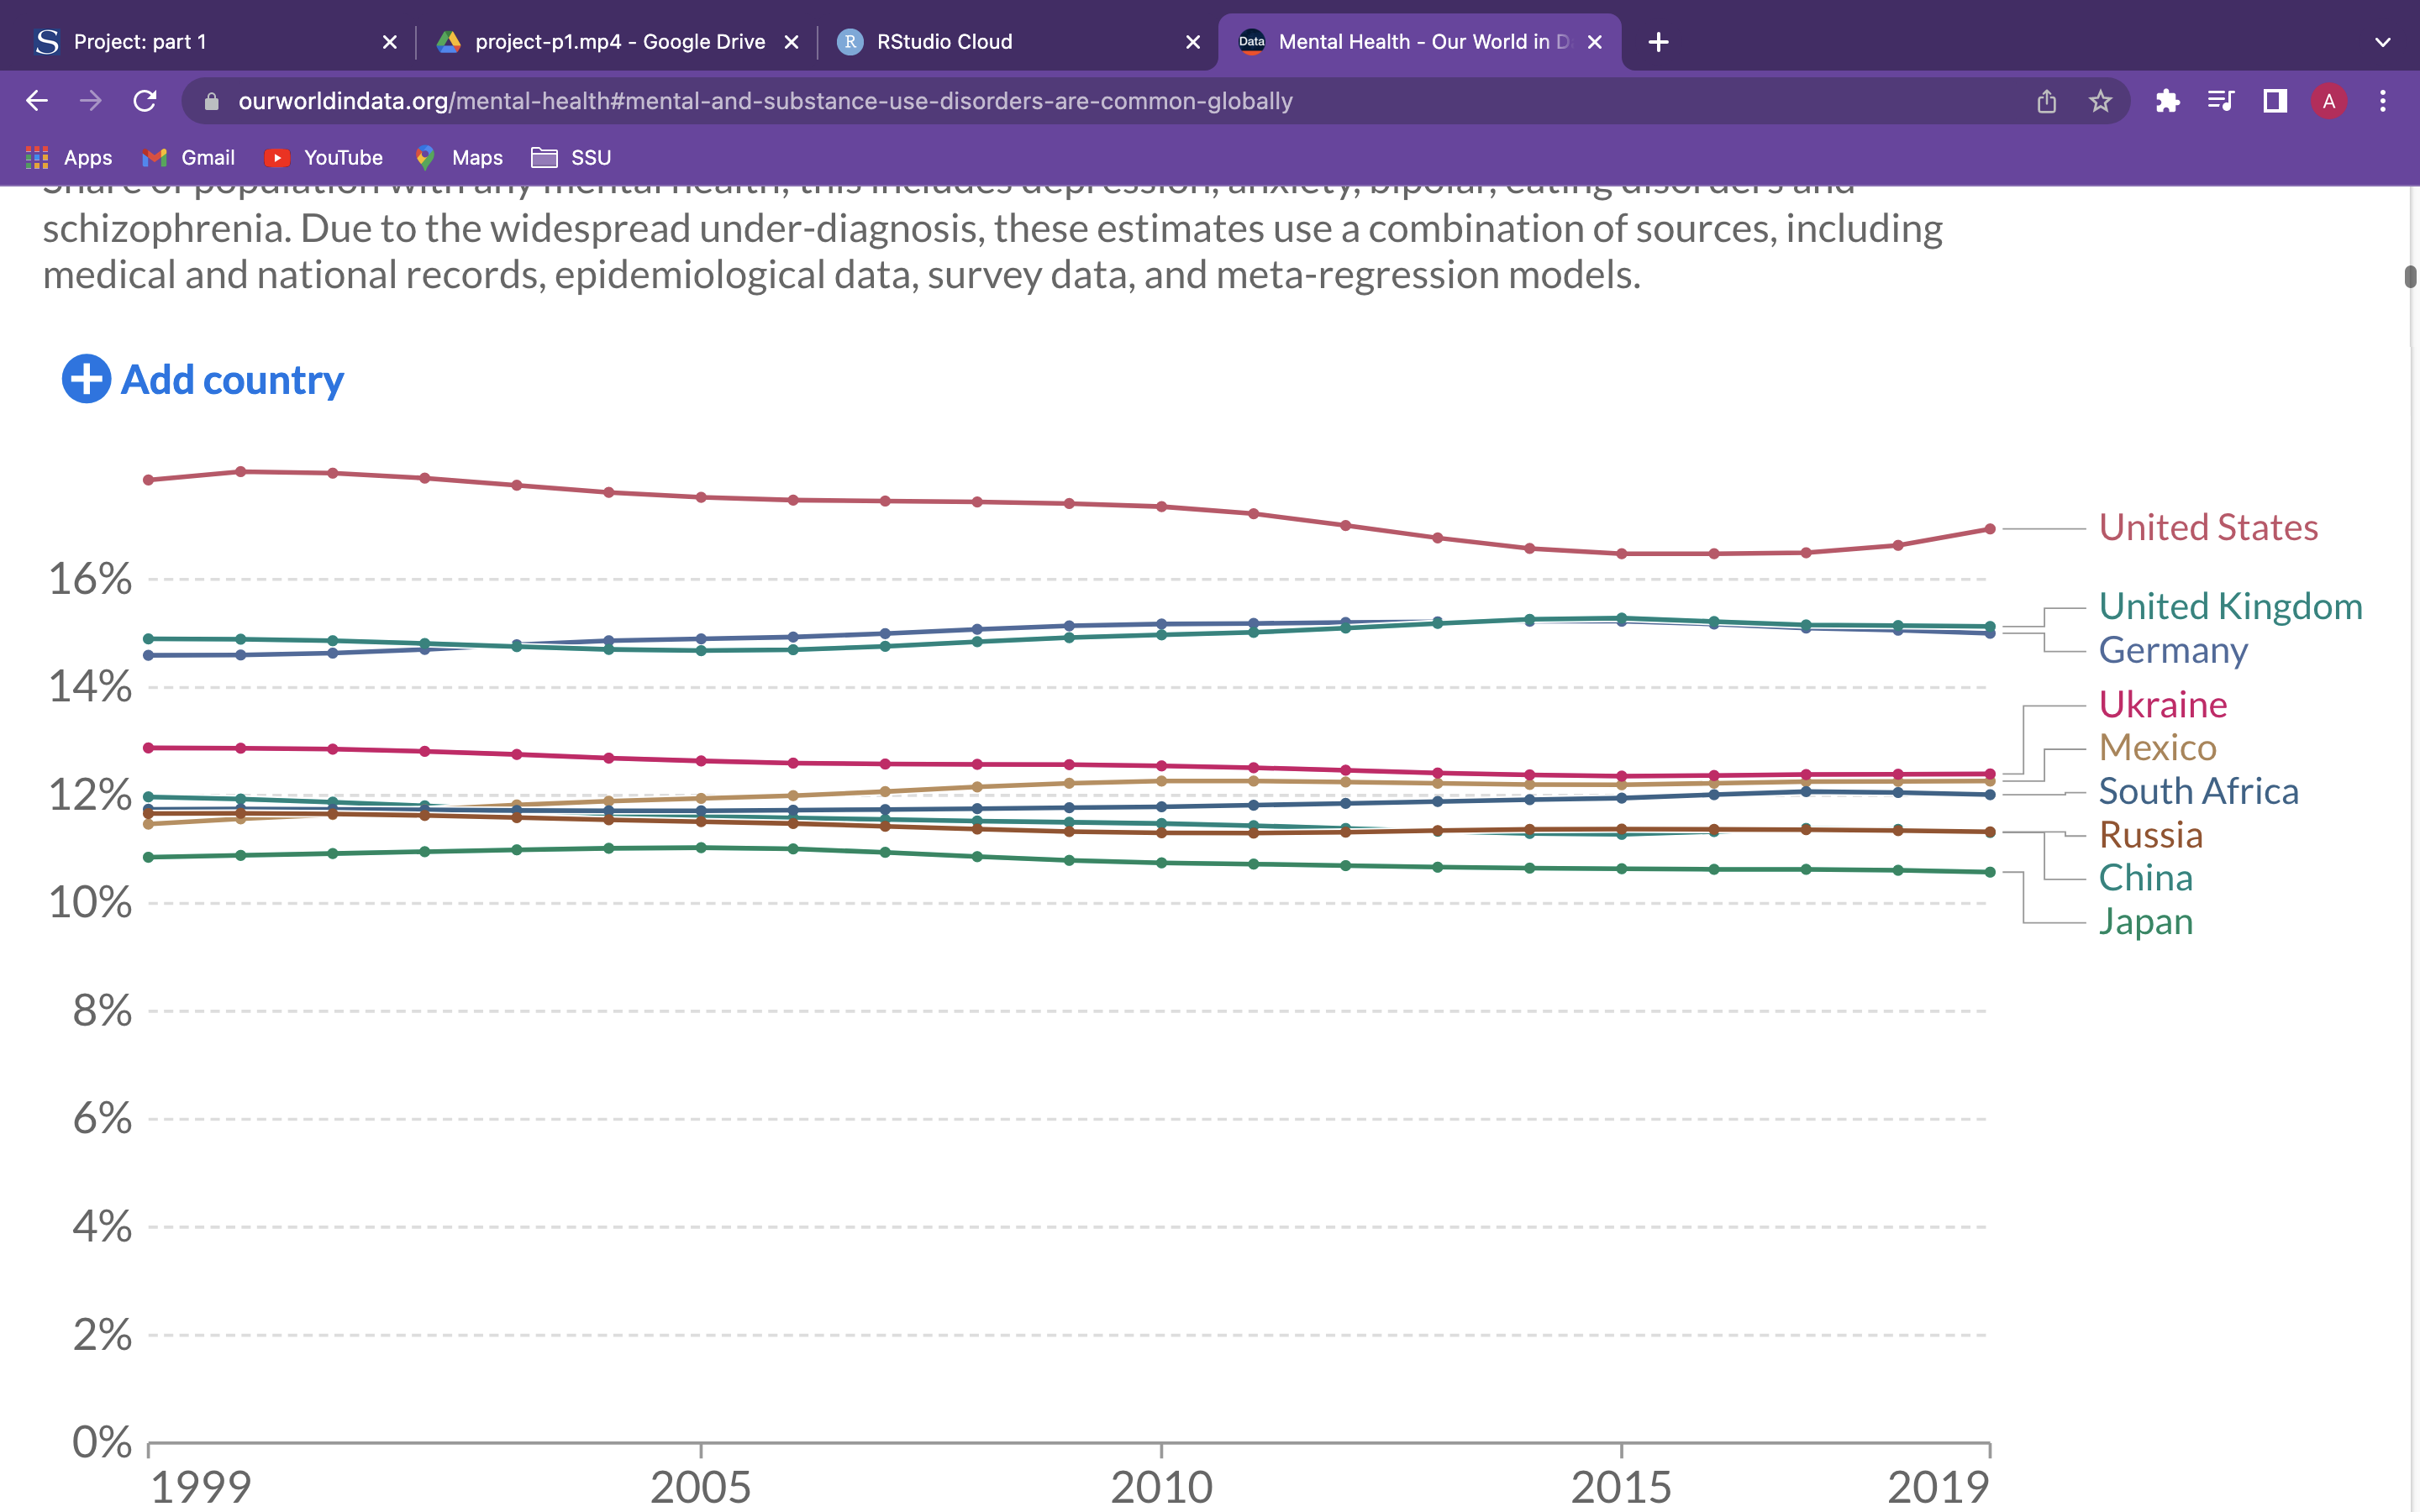
I downloaded Lack of access to handwashing facilities is a large risk factor for death data from Our World in Data. I chose this data set because I am interested in understanding how much Mental and Substance Disorders have increased since the 1990’s.
This is the link to the data.
The following code chunk loads the package I will use and read in and prepare data for analysis.
- Read the data in.
- Use glimpse to see the names and types of columns.
glimpse(Share_of_population_with_mental_health_disorders_1990_to_2019)
Rows: 6,780
Columns: 4
$ Entity                                                                        <chr> …
$ Code                                                                          <chr> …
$ Year                                                                          <dbl> …
$ `Prevalence - Mental disorders - Sex: Both - Age: Age-standardized (Percent)` <dbl> …
# View(Share_of_population_with_mental_health_disorders_1990_to_2019)
- Use output from
glimpse(and View) to prepare data for analysis.
Create the object
regionswhich is a list of regions I want to extract from dataset.Change the name of 1st column to Regions and 4th column to Prevalence of Mental Disorders
Use
filterto extract the rows I want to keep: Year >= 1990 and Region inregionsSelect the Columns to keep: Regions, Year, Prevalence - Mental Disorders.
Assign output to regional mental disorders.
Display the first 10 rows of Prevalence - Mental Disorders.
regions <- c("United States",
             "United Kingdom",
             "Germany",
             "Ukraine",
             "Mexico",
             "Iran",
             "Russia",
             "China",
             "South Africa",
             "Japan")

Share_of_population_with_mental_health_disorders_1990_to_2019 %>%
  rename(Region = 1, Prevalence_of_Mental_Disorders = 4) %>%
  filter(Year >= 1990-2019, Region %in% regions) %>%
  select(Region, Year, Prevalence_of_Mental_Disorders)
# A tibble: 300 × 3
   Region  Year Prevalence_of_Mental_Disorders
   <chr>  <dbl>                          <dbl>
 1 China   1990                           11.6
 2 China   1991                           11.8
 3 China   1992                           11.9
 4 China   1993                           12.0
 5 China   1994                           12.0
 6 China   1995                           12.0
 7 China   1996                           12.0
 8 China   1997                           12.0
 9 China   1998                           12.0
10 China   1999                           12.0
# … with 290 more rows
Share_of_population_with_mental_health_disorders_1990_to_2019
# A tibble: 6,780 × 4
   Entity      Code   Year `Prevalence - Mental disorders - Sex: Bot…`
   <chr>       <chr> <dbl>                                       <dbl>
 1 Afghanistan AFG    1990                                        16.7
 2 Afghanistan AFG    1991                                        16.8
 3 Afghanistan AFG    1992                                        16.9
 4 Afghanistan AFG    1993                                        17.0
 5 Afghanistan AFG    1994                                        17.1
 6 Afghanistan AFG    1995                                        17.2
 7 Afghanistan AFG    1996                                        17.4
 8 Afghanistan AFG    1997                                        17.6
 9 Afghanistan AFG    1998                                        17.7
10 Afghanistan AFG    1999                                        17.9
# … with 6,770 more rows
Add a picture
 Write the
data to file in the project directory
Write the
data to file in the project directory
write_csv(Share_of_population_with_mental_health_disorders_1990_to_2019, file ="Prevalence of Mental Disorders" )